קובץ:Interpolation example polynomial.svg

גודל התצוגה המקדימה הזאת מסוג PNG של קובץ ה־SVG הזה: 600 × 480 פיקסלים. רזולוציות אחרות: 300 × 240 פיקסלים | 960 × 768 פיקסלים | 1,280 × 1,024 פיקסלים | 2,560 × 2,048 פיקסלים.
לקובץ המקורי (קובץ SVG, הגודל המקורי: 600 × 480 פיקסלים, גודל הקובץ: 13 ק"ב)
| זהו קובץ שמקורו במיזם ויקישיתוף. תיאורו בדף תיאור הקובץ המקורי (בעברית) מוצג למטה. |
תקציר
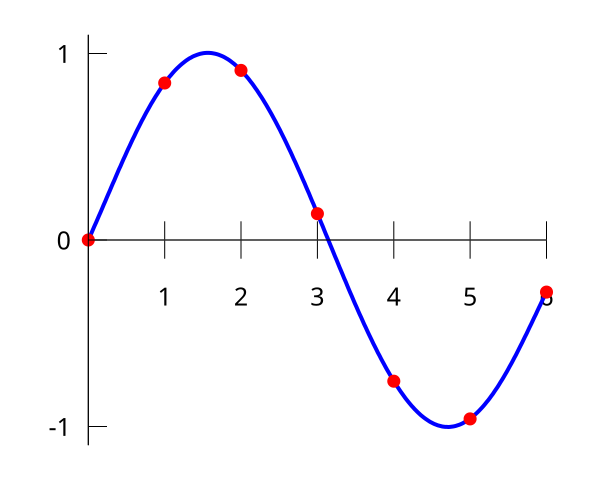
| תיאור | IIllustration of polynomial interpolation of a data set. The same data set is used for other interpolation algorithms in the Interpolation. |
| תאריך יצירה | |
| מקור | self-made in Gnuplot |
| יוצר | Berland |
Based on png-version by User:Jitse Niesen (with gnuplot source code), and on svg-version by User:Cronholm144.
Gnuplot source code
set terminal svg fname "Vera" fsize 25
set output "Interpolation_example_polynomial.svg"
set key off
set xzeroaxis
set xtics axis 1,1
set ytics nomirror 1
set samples 300
set border 2
f(x) = - 0.0001521*x**6 - 0.003130*x**5 + 0.07321*x**4 - 0.3577*x**3 +  0.2255*x**2 + 0.9038*x
set yrange [-1.1:1.1]
plot f(x) with lines linetype 3 linewidth 4, \
     "-" with points linetype 1 pointtype 7 pointsize 0.7, \
       0 with lines linetype -1 linewidth 1
0 0
1 0.8415
2 0.9093
3 0.1411
4 -0.7568
5 -0.9589
6 -0.2794
e
Please use at least version 4.2 of Gnuplot for smooth lines in SVG.
רישיון
| היצירה הזאת שוחררה לנחלת הכלל על־ידי היוצר שלה, Berland. זה תקף בכל העולם. יש מדינות שבהן הדבר אינו אפשרי על פי חוק, אם כך: Berland מעניק לכל אחד את הזכות להשתמש ביצירה הזאת לכל מטרה, ללא שום תנאי, אלא אם כן תנאים כאלה נדרשים לפי החוק. |
היסטוריית הקובץ
ניתן ללחוץ על תאריך/שעה כדי לראות את הקובץ כפי שנראה באותו זמן.
| תאריך/שעה | תמונה ממוזערת | ממדים | משתמש | הערה | |
|---|---|---|---|---|---|
| נוכחית | 16:11, 26 ביוני 2007 | | 480 × 600 (13 ק"ב) | wikimediacommons>Berland | == Summary == {{Information |Description=IIllustration of polynomial interpolation of a data set. The same data set is used for other interpolation algorithms in the Interpolation. |Source=self-made i |
שימוש בקובץ
הדף הבא משתמש בקובץ הזה: